SQL and Excel
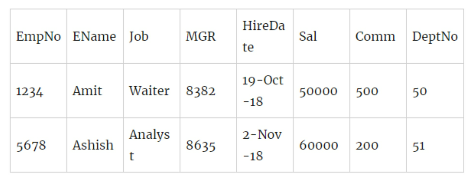
Below is the employee(emp) table:
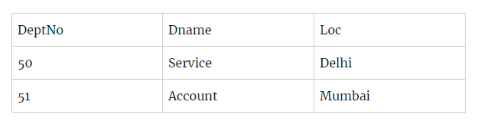
Below is the department(dept) table:
Q.1. Show all the data from emp table
SELECT * FROM emp;
Q.2. Show all the data from Dept table
SELECT * FROM dept;
Q.3. Display distinct jobs from Dept table
SELECT DISTINCT(job) FROM dept;
Q.4. Number of employees
SELECT COUNT(*) FROM emp;
Q.5. List the employee in the ascending order of salary
SELECT * from emp ORDER BY Sal;
Q.6. Show the employee information of the Managers
SELECT * from emp WHERE EmpNo in (SELECT MGR FROM emp);
Q.7. List of employees who were hired before 2018.
SELECT * FROM emp WHERE HireDate < ’01-Jan-2018′;
Q.8. List the detail of employees along with the annual salary, order it on the annual salary
SELECT *, sal*12 as Annual_Income
FROM emp
ORDER BY Annual_Income;
Q.9. Display number of months of experience of all the Managers
SELECT *, months_between(sysdate,HireDate) as Exp
FROM emp
WHERE EmpNo IN (SELECT MGR FROM emp);
Q.10. Display the name of the employees with Commission(Comm) less than Salary (Sal)
SELECT EName
FROM emp
WHERE Comm < Sal;
Q.11. Display the name of the employee with Daily income more than 200
SELECT EName
FROM emp
WHERE (sal/30)>200;
Q.12. Show information of all the Waiters
SELECT *
FROM emp
WHERE Job = ‘Waiter’;
Q.13. Show all the employee who joined on 01-Aug-2018, 4-Aug-2018, 29-Oct-2018 in descending order of Hire Date
SELECT *
FROM emp
WHERE HireDate IN (’01-Aug-2018′,’04-Aug-2018′,’29-OCt-2018′)
ORDER BY HireDate DESC;
Q.14. List the employees who joined in 2018
SELECT *
FROM emp
WHERE HireDate BETWEEN (’01-Jan-2018′) AND (’31-Dec-2018′);
Q.15. Employees with Annual Salary between 600000 and 1000000
SELECT *
FROM emp
WHERE Sal*12 BETWEEN 600000 AND 1000000;
Q.16. List the employees with name starting with N and containing 5 alphabets
SELECT *
FROM emp
WHERE EName LIKE ‘N____’;
Or
SELECT *
FROM emp
WHERE EName LIKE ‘N%’ AND len(EName) = 5;
Q.17. List the employee with the third alphabet in their name as K
SELECT *
FROM emp
WHERE Upper(EName) LIKE ‘__K%’;
Q.18. Show the name of the employees who joined in August month of any year.
SELECT *
FROM emp
WHERE to_char(HireDate,’mon’)=’Aug’
Q.19. Show the employee details of those who were hired in the 90s
SELECT *
FROM emp
WHERE to_char(HireDate, ‘yy’) LIKE ‘9_’;
Q.20. Show the employee who were not hired in the month of October.
SELECT *
FROM emp
WHERE to_char(HireDate,’MON’) NOT IN ‘(‘Oct’);
Q.21. List the total information of the employees along with DName and Location of people working under ‘Accounts’
SELECT *
FROM emp e
INNER JOIN dept d ON (e.DeptNo = d.DeptNo)
WHERE d.DName = ‘Account’
Q.22. List all the employees with more than 10 years of experience as of now
SELECT *
FROM emp
WHERE TIMESTAMPDIFF(MONTH, HireDate, sysdate)
Q.23. List the detail of all the employees whose salary is less than that of Aman
SELECT *
FROM emp
WHERE sal > (SELECT sal FROM emp WHERE EName = ‘Aman’);
Q.24. Show the name of those employees who are senior to their own Manager.
SELECT *
FROM emp w, emp m
WHERE w.MGR = m.EmpNo and w.HireDate < m.HireDate
Or
SELECT *
FROM emp w, emp m
WHERE w.EmpNo = m.MGR and w.HireDate < m.HireDate
Q.25. Show the employees who are senior to Aman
SELECT *
FROM emp
WHERE HireDate < (SELECT HireDate FROM emp WHERE EName = ‘Aman’)
Q.26. Show the employees who are senior to Aman and are working in Delhi or Bangalore
SELECT *
FROM emp e, dept d
WHERE UPPER(d.loc) IN (‘DELHI,’BANGALORE’) AND e.DeptNo = d.DeptNo
AND e.HireDate < (SELECT e.HireDate FROM emp e WHERE EName = ‘Aman’);
Q.27. Show the employees with the same job as Aman or Amit.
SELECT *
FROM emp
WHERE job in (SELECT job from emp WHERE EName IN (‘Aman’,’Amit’);
Q.28. Find the highest salary of any employee
SELECT MAX(Sal)
FROM emp;
Q.29. Find the detail of the employee with the minimum pay
SELECT *
FROM emp
WHERE Salary = (SELECT MIN(Salary) FROM emp);
SQL Tricky interview Questions
Q.30. What is the difference between NVL and NVL2?
Ans. In SQL, NVL() converts a null value to an actual value. Data types that can be used are date, character and number. Data type must match with each other i.e. expr1 and expr2 must of same data type.
NVL (expr1, expr2)
expr1 is the source value or expression that may contain a null.
expr2 is the target value for converting the null.
NVL2(expr1, expr2, expr3) : The NVL2 function examines the first expression. If the first expression is not null, then the NVL2 function returns the second expression. If the first expression is null, then the third expression is returned i.e. If expr1 is not null, NVL2 returns expr2. If expr1 is null, NVL2 returns expr3. The argument expr1 can have any data type.
NVL2 (expr1, expr2, expr3)
expr1 is the source value or expression that may contain null
expr2 is the value returned if expr1 is not null
expr3 is the value returned if expr2 is null
Q.31. What is the function of COALESCE()?
The COALESCE() function examines the first expression, if the first expression is not null, it returns that expression; Otherwise, it does a COALESCE of the remaining expressions.
The advantage of the COALESCE() function over the NVL() function is that the COALESCE function can take multiple alternate values. In simple words COALESCE() function returns the first non-null expression in the list.
Q.32. How to find count of duplicate rows?
Select rollno, count (rollno) from Student
Group by rollno
Having count (rollno)>1
Order by count (rollno) desc;
Q.33. How to find Third highest salary in Employee table using self-join?
Select * from Employee a Where 3 = (Select Count (distinct Salary) from Employee where a.salary<=b.salary;
Q.34. How to calculate number of rows in table without using count function?
SELECT table_name, num_rows
FROM user_tables
WHERE table_name=’Employee’;
Q.35. What is the use of FETCH command?
The FETCH argument is used to return a set of number of rows. FETCH can’t be used itself, it is used in conjuction with OFFSET.
SELECT column_name(s)
FROM table_name
ORDER BY column_name
OFFSET rows_to_skip
FETCH NEXT number_of_rows ROWS ONLY;
Q.36. Write a query to find maximum salary of each department in an organization
SELECT Department_Name, Max(Salary)
FROM Department_Table
GROUP BY Department_Name
Q.37. What is wrong with the following query?
SELECT Id, Year(PaymentDate) as PaymentYear
FROM Bill_Table
WHERE PaymentYear > 2018;
Though the variable PaymentYear has already been defined in the first line of the query, but this is not the correct logical process order. The correct query will be
SELECT Id, Year(PaymentDate) as PaymentYear
FROM Bill_Table
WHERE Year(PaymentDate) > 2018;
Q.38. What is the order of execution in a query?
The order of query goes like this:-
FROM – Choose and join tables to get the raw data
WHERE – First filtering condition
GROUP BY – Aggregates the base data
HAVING – Apply condition on the base data
SELECT – Return the final data
ORDER BY – Sort the final data
LIMIT – Apply limit to the returned data
Q.39. What is ROW_NUMBER() function?
It assigns a unique id to each row returned from the query ,even if the ids are the same. Sample query:-
SELECT emp.*,
row_number() over (order by salary DESC) Row_Number
from Employee emp;
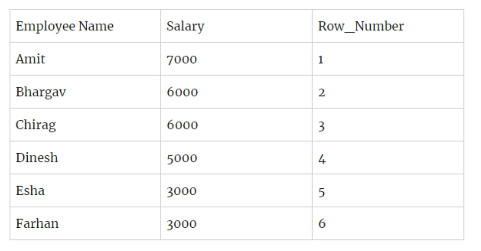
Even when the salary is the same for Bhargav and Chirag, they have a different Row_Number, this means that the function row_number just gives a number to every row
Q.40. What is RANK() function?
RANK() function is used to give a rank and not a row number to the data set. The basic difference between RANK() and ROW_NUMBER is that Rank will give equal number/rank to the data points with same value. In the above case, RANK() will give a value of 2 to both Bhargav and Chirag and thus will rank Dinesh as 4. Similarly, it will give rank 5 to both Esha and Farhan.
SELECT emp.*,
RANK() over (order by salary DESC) Ranking
from Employee emp;
Q.41. What is NTILE() function?
NTILE() function distributes the rows in an ordered partition into a specific number of groups. These groups are numbered. For example, NTILE(5) will divide a result set of 10 records into 5 groups with 2 record per group. If the number of records is not divided equally in the given group, the function will set more record to the starting groups and less to the following groups.
SELECT emp.*,
NTILE(3) over (order by salary DESC) as GeneratedRank
from Employee emp
This will divide the complete data set in 3 groups from top. So the GeneratedRank will be 1 for Amit and Bhargav, 2 for Chirag and Dinesh: 3 for Esha and Farhan
Q.42. What is DENSE_RANK() ?
This gives the rank of each row within a result set partition, with no gaps in the ranking values. Basically there is no gap, so if the top 2 employees have the same salary then they will get the same rank i.e. 1 , much like the RANK() function. But, the third person will get a rank of 2 in DENSE_RANK as there is no gap in ranking where as the third person will get a rank of 3 when we use RANK() function. Syntax below:-
SELECT emp.*,
DENSE_RANK() OVER (order by salary DESC) DenseRank
from Employee emp;
Q.43. Write a query to get employees name starting with vowels.
SELECT EmpID,EmpName
FROM Employee
where EmpName like ‘[aeiou]%’
Q.44. Write a query to get employee name starting and ending with vowels.
SELECT EmpID,EmpName
FROM Employee
where EmpName like ‘[aeiou]%[aeiou]’
Q.45. What are the different types of statements supported in SQL?
There are three types of statements in SQL:
- DDL – Data Definition Language
- DML – Data Manipulation Language
- DCL – Data Control Language
Q.46. What is DDL?
It is used to define the database structure such as tables. It includes 3 commands:-
- Create – Create is for creating tables
CREATE TABLE table_name (
column1 datatype,
column2 datatype,
column3 datatype,
….
);
- Alter – Alter table is used to modifying the existing table object in the database.
ALTER TABLE table_name
ADD column_name datatype
- Drop – If you drop a table, all the rows in the table is deleted and the table structure is removed from the database. Once the table is dropped, you can’t get it back
Q.47. What is DML?
Data Manipulation Language is used to manipulate the data in records. Commonly used DML commands are Update, Insert and Delete. Sometimes SELECT command is also referred as a Data Manipulation Language.
Q.48. What is DCL?
Data Control Language is used to control the privileges by granting and revoking database access permission
Q.49. What are the important SQL aggregate functions?
- AVG()
- COUNT()
- MAX()
- MIN()
- SUM()
Q.50. What is Normalization? How many Normalization forms are there?
Normalization is used to organize the data in such manner that data redundancy will never occur in the database and avoid insert, update and delete anomalies.
There are 5 forms of Normalization
First Normal Form (1NF): It removes all duplicate columns from the table.
Creates a table for related data and identifies unique column values
Second Normal Form (2NF): Follows 1NF and creates and places data subsets in an individual table and defines the relationship between tables using a primary key
Third Normal Form (3NF): Follows 2NF and removes those columns which are not related through primary key
Fourth Normal Form (4NF): Follows 3NF and do not define multi-valued dependencies. 4NF also known as BCNF
Q.51. How to fetch only common records between two tables?
SELECT * FROM Employee
INTERSECT
SELECT * FROM Employee1
Q.52. Full Outer Join is a combination of which of the following:
a. Left Outer and Left Inner Join
b. Left Outer and Right Inner Join
c. Left Outer and Right Outer Join
d. Left Outer and Right Outer Join
Ans. Full Outer Join is a combination of Left Outer and Right Outer Join in SQL
Q.53. Right Outer Join is similar to:-
a. Right Inner Join
b. Left Inner Join
c. Left Outer Join
d. Right Outer Join
Ans. Right Outer Join is similar to Left Outer Join in SQL
Q.54. What is the use of OFFSET command?
The OFFSET argument is used to identify the starting point to return rows from a result set. Basically, it exclude the first set of records.
OFFSET can only be used with ORDER BY clause. It cannot be used on its own.
OFFSET value must be greater than or equal to zero. It cannot be negative, else return error.
SELECT column_name(s)
FROM table_name
WHERE condition
ORDER BY column_name
OFFSET rows_to_skip ROWS;
Q.55. Difference between DELETE and DROP command.
DROP is a Data Definition Language (DDL) command which removes the named elements of the schema like relations, domains or constraints and you can also remove an entire schema using DROP command.
DROP SCHEMA schema_name RESTRICT;
DROP Table table_name CASCADE;
DELETE is a Data Manipulation Language (DDL) command and used when you want to remove some or all the tuples from a relation. If WHERE clause is used along with the DELETE command it removes only those tuples which satisfy the WHERE clause condition but if WHERE clause is missing from the DELETE statement then by default all the tuples present in relation are removed.
DELETE FROM relation_name
WHERE condition;
There were some output related questions where a table was given, mostly on group by, order by, top, etc. command
ADVANCE EXCEL
Q.56. What are the ways to create a dynamic range?
Creating a Table
Using OFFSET and COUNTA Functions
Q.57. What is the order of operations that Excel uses while evaluating formulas?
- PEMDAS Rule
- Parenthesis
- Exponentiation
- Multiplication/Division
- Addition
- Subtraction
Q.58. Difference between FUNCTION and FORMULA in excel?
FORMULA – is a statement which written by the user for calculations. Ex: =1+2+3
FUNCTION – is a built-in formula by Excel. Ex: =SUM(1+2+3)
Q4)How will you find duplicate values in a column?
To highlight duplicate values – use Conditional Formatting
To get a number of duplicate values – use COUNTIF function.
76.What is the use of Slicer and Timeline in Excel?
Slicer – is used to filter the Table, Pivot Table data visually.
Timeline – is used to filter the dates interactively by Year, Month, Quarter and Day.
Q.59. What is Recommended Pivot Tables and Recommended Charts?
Recommended Pivot Table – Based on the raw data, Excel will recommend some pivot table automatically.
Recommended Charts – Same like as above, Excel will recommend charts (Ex: Column chart, Bar Chart, etc…) based on the data.
Q.60.What is the Name Manager in Excel?
Names which we give for a cell/Range, Table will be managed by the Name Manager.
Q.61. What is COUNT and COUNTA?
COUNT – Counts the number of cells which contains only numbers except for blank cells.
COUNTA – Counts the number of cells which contains alpha-numeric except blank cells.
Q.62. Is it possible to make a single Pivot Table for multiple data sources?
Yes, it is possible. Using Pivot Table Data Modeling technique.
Q.63.VLOOKUP Vs INDEX-MATCH
VLOOKUP – Using VLOOKUP, we can retrieve the data from left to right in the range/Table.
INDEX-MATCH – Using a combination of INDEX and MATCH, we can retrieve the data from left to right/right to left in a range/table.
Q.64. How would you get the data from different data sources?
Data > Get External Data section > Choose your data source
Q.65. What is the use of Option Explicit in VBA?
Option Explicit will force the user to declare variables. If the user uses undeclared variables, an error occurs while compiling the code.
Q.66. What is Excel object Model?
Application – Workbooks – Worksheets – Range
Q.67. What is the default data type in VBA?
A variant is the default data type in VBA.
Q.68. How will you fix/lock the cell/range reference?
Using $ symbol.
Ex: $A $1 – Here Locked Column A and row 1
Q.69. Difference between Function and Subroutine in VBA?
The function will return a value whereas Subroutine may or may not return a value. The function can be called in the procedure. We can create custom functions using FUNCTION like as built-in functions.
Q.70. Does VBA support OOPs concepts?
No, it will not. VBA is Object based programming language, not Object Oriented Programming language.
Q.71. Difference between ThisWorkbook and ActiveWorkbook in VBA?
ThisWorkbook – is the workbook where the VBA code is written. ActiveWorkbook – is the workbook which is in Active state at present.
Q.72. How will you debug codes in VBA?
Step by step execution – F8
Breakpoints – F9
Using Debug.Print
Immediate Window
Watch Window
Q.73. Explain – ADO, ODBC, and OLEDB
ADO –ActiveX Data Objects is a data access framework and is useful to get the data from the databases.
ODBC – Open Database Connectivity is useful to get the data from the external database.
OLEDB – Object Linking and Embedding, Database.
Q.74. What are the different types of errors that you can encounter in Excel?
#N/A
#DIV/0!
#VALUE!
#REF!
#NAME
#NUM
Q.75. What are volatile functions in Excel?
Volatile functions recalculate the formula, again and again, so Excel workbook performance will be slow down. Volatile functions recalculate the formulas when any changes happen in the worksheet.
Ex: NOW (), RAND ()
Q.76. What is the difference between Report and Dashboard?
Dashboards: Dashboard is a visual display of the data and these are dynamic and live, so data is being updated in real time and visuals can show changes from minute to minute.
Reports: Reports are not live and we use historical data to make reports. sometimes Reports are included with visuals such as Table, Graphs and Charts, Text, Numbers or anything.
Q.77. What are the structured references in Excel?
Structured references – Instead of using cell references, we can use an Excel table name or the Column name for reference.
Q.78. Name some of the Excel formats which an Excel file can be saved?
.XLS
.XLSX
.XLSM (Macro-enabled workbook)
.XLSB (Binary format)
.CSV (Comma Separated Values)
Q.79. How will you pass arguments to VBA Function?
In 2 ways we can pass arguments to VBA Functions
- ByVal
- ByRef
Q.80. What are the modules available in VBE?
Code Module: Default module to write procedures.
User form: Helps to develop GUI (Graphical User Interface) applications.
Class Module: Allows to create new objects.
Q.81. What is Collection in VBA?
The Collection object contains a set of related group of items as a single object.
Q.82. What is the difference between an Array and Collection?
Collections and Arrays are used to group variables. In Arrays, before using to start adding elements we normally set the size. But in Collection, we will not set the size, because we don’t know the number of elements in advance.
Q.83. What are the modules available in Excel VBA?
Sheet Module
Thisworkbook Module
Code Module
Userforms
Class Modules
Q.84. How to run faster your VBA macro?
Below are the some tips –
Turn off screenupdating
Declare the variables and avoid “Variant” data type.
Disable events
Using the WITH statement.
Avaoding the Select statement
Select Case instaed of If Then
Q.85. What are the error handling techniques in Excel VBA?
Item On Error Goto 0
On Error Resume Next
On Error Goto [Label]
Err Object
Err. Number
Err. Description
Err. Source
Err. Raise
Error Function
Error Statement
Q.86. What are the ways in which a variable can be declared in the VBScript language?
Implicit Declaration: When variables are used without declaration is called Implicit declaration.
Explicit Declaration: Declaring variables before using is called Explicit Declaration.
Q.87. Name some of the operators available in VBA?
Arithmetic Operators, Comparison Operators, Logical Operators etc.
Q.88. What are the types of arrays available in VBA?
There are 2 types of arrays available in VBA.
Single Dimensional Array: Single Dimensional array is used more often in the VBA. An array uses only one index.
Multi-Dimensional Array: If an array has more than 1 dimension is called Multi-Dimensional Array.
Q.89. Which object is used to work with Databases in the VBA?
Connection Objects are used to provide a connection between Excel and Databases with the help of ADODB Objects. So, we can interact with the database and can use the SQL queries to fetch the data from the database.
ADO stands for, ActiveX Data Objects.
Q.90. Why VBA is not Object Oriented Programming language?
VBA does not support all the OOPs concepts (VBA will support Polymorphism and Encapsulation, not supports Inheritance). Hence, VBA is called Object Based Programming Language.
Q.91. What is Conditional Formatting in Excel?
Conditional Formatting is used to format cells/Range based on a condition/Conditions.
Ex: Highlighting a cell based on cell Value
Q.92. What is a Slicer?
Slicer is used to filter the Table, Pivot Table data. Instead of using Filters section in a Pivot Table, we can use Slicer.
Q.93. What is a Goal Seek in Excel?
Goal Seek – is used to achieve your goal by changing the dependent value.
Ex: If you have taken a personal loan, and if you can able to pay the EMI of 6K instead of 10K, how many months do you need to close your personal loan?
Q.94. What is Scenario Manager in Excel?
Scenario Manager – Excel can be the tool of choice when you have multiple variables, and you want to see the effect on the final result when these variables change.
Q.95. What is a UDF in VBA?
UDF stands for User Defined Function, and these are custom functions. Using VBA, you can create your own functions and those can be used in Excel worksheets as normal built-in Functions.
Q.96. What are the ways to run a macro?
Assigning a macro to a shape.
Assigning a macro to a button
Run a macro from the ribbon
Run a macro using a keyboard short cut key.
Q.97. How do you remove duplicate spaces from a cell?
Using TRIM () function, we can delete duplicate spaces and gives unique/single space between words.
Q.98. What is Data Validation in Excel?
Data Validation – is used to validate the Data in a cell/Range. In Data Validation, we have criteria such as List, Whole Number etc. And have custom criteria option where we can give function/formula.
Q.99. How will you find the number of duplicate values in a range?
There might be different ways to find the duplicate values from a range. One of that is, using COUNTIF function we can find duplicate values.
Q.100. Which function will you use instead of VLOOKUP?
Instead of VLOOKUP, we can use INDEX and MATCH function. Limits of VLOOKUP is we cannot fetch the data from the left side of the Lookup range. Using INDEX-MATCH, we can fetch the data any ways.
Q.101. How would you add a new column to an existing pivot table for calculations?
Using Calculated Field
Q.102. Can you name some Text Functions?
CONCATENATE( ) – used to join several text strings to one string TEXT( ) – Converting a value into text formatting PROPER ( ) – Arranging the characters in proper way. LEFT ( ) – Returns the specified number of characters from the starting character.
Guesstimate
Q.103.Number of Maggi sold in a day in India
I took a bottom-up approach.
Considering an ordinary, urban household with 4 individuals
Number of Maggi needed per month = 10
Therefore, per head consumption = (10/4) = 2.5 Maggi per person
Population = 1.3 billion
Urban population: 70% of total population
Above poverty line population: 40% of total population
Therefore, net population to consider: 1300*0.7*0.4 = 364 million.
Population distribution: (Age-wise)
0 – 10 (consume less than 2.5 packets per month, say 2 packets): 20% of the population
{which equals to (364*0.2*2) million packets per month = 145.6 million packets per month}
10 – 60 (consume 3 packets per month): 65% of the population
{which equals to (364*0.65*3) million kg per month = 709.8 million packets per month}
60+ (consume less than 2.5 packets per month, 2 packets): 15% {which equals to (364*0.15*2) million packets per month = 109.2 million packets per month}
Total approximate consumption = (145.6 + 709.8+109.2) million packets/month = 964.6 million packets/month
Assuming a month of 30 days, per day consumption = (964.6/30) million packets per day = 32.15 million packets per day.
Q.104. How many t-shirts e-commerce companies selling in India per day?
We can approach this problem in two ways:
Demand side
Supply side
I am going to solve using demand of t-shirts in the market
Total population of india : 1 bn (approx)
Reach to internet : 40% =400 Mn
Reach of ecommerce companies to deliver products : 3/4th = 300Mn
Let’s assume 50% are male and 50% are female
Lets solve for male population first:
Now i have divided males in the four categories on the basis of age because demand of t-shirts for different age groups will be different
0–15 yr = 45 Mn, on an average, individual own 4 t shirts -> 4*45=180 Mn
16–22 yr = 23 Mn, on an average individual own 4 t shirts -> 4*23 = 92 Mn
23–50 yr = 65 Mn, on an average individual own 3 t shirts -> 3*65 = 195 Mn
50 – 80 yr = 18 Mn, on an average individual have 2 t shirts -> 2*18 = 36 Mn
Total t shirts own by men : 180 + 92+195+36 = 503 Mn ~ 500 Mn
Let’s solve for female population now:
0–15 yr = 45 Mn, on an average individual own 2 t shirts -> 2*45=90 Mn
16–22 yr = 23 Mn, on an average individual own 4 t shirts -> 4*23 = 92 Mn
23–30 yr = 15 Mn, on an average individual own 3 t shirts -> 3*15 = 45 Mn
30 – 80 yr = 67 Mn -> we can neglect this section. Only few ladies prefer to use t-shirts in this age group.
Total t shirts own by females : 90+92+45 = 227 Mn ~ 230 Mn
Total t shirts own by men + women = 500+230=730 Mn
Average life of a t shirt = 2 year
Demand per year = 365 Mn ~ 360 Mn
Online portals provide coupons and offers but because of trust factor and fitting issues, people in india still prefer to buy offline, So i am assuming 30% of people buy t shirt from ecommerce portal and 70% are buying from market.
Total number of t-shirts sold through ecommerce platform per year in India= .3*360 = 108 Mn ~ 100 Mn per year
Number of t-shirts sold in India per day(From ecommerce portal) = 100 * 10^6/365 ~ 27,000
Q.105.What is the number of laptops sold in Bangalore on an average routine day?
Laptop is a costly product. I am assuming that people buy laptop only when they needed. That’s why i am going to calculate potential market of laptops in India.
Total population of Bangalore = 18Mn ~ 20Mn
Let’s divide population on the basis of age
0–18 Yr – 30% of 20 Mn = 6 Mn -> We can neglect this age group because generally they don’t need personal laptop and when needed, they prefer to use others laptop.
19–22 Yr – 10% of 20 Mn = 2Mn -> 0.6*2 Mn -> 1.2 Mn (This is the college age group. Most of the college students need a laptop. Assumed 60% of them own a laptop)
22–50 Yr = 40% of 20 Mn = 8 Mn. 22-50 age group is the working class of the society. I have divided this class into 3 major categories.
White collar employees (25%)
Blue collar employees (50%)
Small business owners (25%)
Assumed 80% and 30% people in the category of white collar employees and Small business owners respectively own a laptop or PC. We can neglect blue collar employees.
80% white collar own a laptop or PC -> 1.6 Mn
Small business owners own laptops or PC -> 0.6 Mn
50–80 Yr = 20% = 4 Mn -> we can ignore this age group
Total laptop + PC users in Bangalore = 1.2+1.6+.6= 2.4 Mn
Corporate offices/Schools/Computer centers generally have desktop. Lets assume 60% are desktops.
Laptops = 40% -> 0.9 Mn
Average life of a laptop = 5 year ( in India )
Number of sold per day in Bangalore = 0.9 Mn/ 365*5 ~ 500 laptops
1Q.106. What are the number of smartphones sold in India per year?
Population of India : 1200 mn
Population above poverty line: 70% 840 mn
Population below 14 years: 30%
Hence, proxy figure: 588 mn
Rural Population (70%) : 410 mn
Rural Households: 82 Mn
Rural Mobile Penetration: Avg 2 per household- 164 Mn
In rural areas assume that a new mobile is bought once in 3 years. Hence, new mobiles bought In current year- 55 Mn
Urban (30%) :176 Mn
Assume Avg No of Mobiles per person : 1.5
Urban Mobile Penetration: 265 Mn
Assuming that a new mobile is bought once in 1.5 years. Hence new mobiles in current year- 176 Mn
Total New Mobiles: 231 mn Assuming 3 out of 10 new mobiles are smart phones No. of smart phones sold=70 Mn
Q.107. What is the total number of people who get a new job in India in a year?
Observations:
35 million students enroll in India(Undergraduate, graduate, doctorate, diploma)
72% of 35 million graduate every year = 25 million
Students completing 10th grade = 20 million
Students completing 12th grade= 15 million
Unemployed graduates of the previous year= 15 million
(Since 60% of 25 million graduates are unemployed)
GDP growth rate is 7%
Calculations:
40% of 25 million graduates are only employed= 10 million
Assuming 500,000 of the previous year’s graduates get a new job 100,000 starts working after 12th grade due to poverty, poor grades etc An estimate of 50,000 starts working after 10th grade due to poverty,poor grades etc
10,000 people already on workforce end up with a new job
Total= 10 million + 500,000 + 100,000 + 50,000 + 10,000 = 10.66 million (approx)
Note: Migrants working in India are negligible Due to urbanization, very few go for work without completing their 10th grade
Increased feminism has a significant effect on the estimates OYO Rooms Case Study
Q.108. What are the KPIs for OYO rooms?
The main KPIs for any online room booking company could be:-
a. Online Rating
b. Occupancy %
c. Average daily Rate
d. Revenue per available room
e. Customer Satisfaction
f. Advertising ROI
Q.109. How do calculate the average daily rate?
If I were to calculate, it should be equal to Total Revenue Per Room/Total rooms occupied
Q.110. What are the types of marketing scheme?
- Banners on websites
- Video ads on youtube
- Pamphlet distribution
- Hoarding
- Email/SMS
Q.111. Any idea about Average Length of Stay?
The ALOS metrics makes it easy to identify the length of stay of guests at your hotel. This is calculated by dividing the occupied rooms by a number of bookings. It is said that a higher number means an improved profit as less labor is required. On the other hand, a lower ALOS results in reduced profit. The concept is that if a guest stays for a long period of time then it requires less labor. Whereas if several guests book rooms for one-nights for the same period of time then it requires more labor.
Q.112. What is Market Penetration Index?
To stay ahead of the competition you need to know how your hotel is performing in the local market. The MPI metrics can be used as a tool to compare your hotel’s market share with your competitors. It helps you to know how many guests are choosing your hotel as compared to other hotels in your location. It can be calculated by dividing your hotel’s occupancy by market occupancy and multiplying by 100. If the result is more than 100 that means you have a very good hold on the market. Else if it is less than 100 then it indicates your hotel isn’t performing well and losing a lot of bookings to your competitors.
Q.113. How many red colored Swift cars are there in Delhi?
The approach to such problems follows a MECE approach. MECE expands to Mutually Exclusive Collectively Exhaustive, which trivially means breaking your problem down to Non-overlapping segments which add up together to give your final solution.
Let’s solve the guesstimate
Population of Delhi: 20 Mn Children or college going = 20% of 20 Mn -> 4 Mn
Senior citizens = 20% of 20 Mn -> 4 Mn
Working people = 60% of 20 Mn -> 12 Mn
let there are 5 brands of car and each brand have 10 cars which are equally distributed. So in total, we have 50 models of cars running in the streets. This does not include luxury cars.
Working class people, let’s assume half are married and half remain unmarried. So married -> 6 Mn and unmarried -> 6 Mn
Married couples:- Number of married couples = 6 Mn/2 -> 3 Mn
I am assuming 10% belong to the rich class and prefer luxury cars and 20% cannot afford a car. The rest 70% has one car each.
70% of 3 Mn = 2.1 Mn
There is the equal distribution of above mentioned 50 cars among these 2.1 couples again. So the number of Swift Cars right now is 2.1 Mn / 50 = 0.042 Mn. I am assuming Swift car comes in 10 colors. Hence number of red swift cars in married couples is 0.0042 Mn -> 42,000
Unmarried couples:-
Out of 6 Mn unmarried couples, Only 10% can afford mid range non luxury cars. Hence no of cars = 6 lakh. These are again divided into 50 models as above and each model has 10 colors. So number of red colored swift cars among unmarried people = 6 lakh / 500 -> 12,000
Senior citizens
Out of 2 Mn families(4 Mn people), 20% i.e. 0.4 Mn families own a car. Again, as above, these cars are divided into 50 models with each model having 10 colors. So 4 lakh/500 -> 8,000
Total number of red colored swift cars in Delhi = 42,000 + 12,000 + 8,000 -> 62,000
Q.114. The client of our company is The Minnesota Mining Manufacturing Company of United States whose main office is in Minnesota, United States. The company manufactures products such as car décor products, medical products, adhesives, electronic products and dental products etc. On a global level, the company is a thriving one with its employee population of over 84000 and product types of over 55000 and business in over 60 countries. One of their major investments is in Brazil, which is the manufacturing of a particular kind of steel that is only produced by two other companies in Brazil. Throughout the world, Steel has an amazing market capture and increasing demand. Now, the company has hired BCG to frame a plan for the progress of this business only after acquiring a proper knowledge of the market trend. What would you do about it?
Possible answer:
The candidate would begin by discussing the market dynamics in Brazil as well as globally on which he/she has to base the suggestion. Furthermore, an idea is to be framed up about the cost, market, value, customers, transportation facility and price if the steel is to be exported. Also, Brazil has some taxes on foreign goods export which would only add up to the price. Since the local market is more profitable than the international trade, it is advisable to try out the products first in the local market of Brazil since there is a chance of price war.
R Language
Q.115. How can you combine 2 vectors?
Vectors can be combined from 2 to 1 by using the c() function
Example.
> first <- c(1,2,3,4)
> second <- (“a”, “b”, “c”)
> third <- c(first, second)
> print(third)
[1] “1” “2” “3” “4” “a” “b” “c”
Q.116. What is the difference between Matrix and an array ?
Matrix can have only 2 dimensions where as an array can have as many dimensions as you want. Matrix is defined with the help of data, number of rows, number of columns and whether the elements are to be put in row wise or column wise.
In array you need to give the dimension of the array. An array can be of any number of dimensions and each dimension is a matrix. For example a 3x3x2 array represents 2 matrices each of dimension 3×3.
Q.117. What is the difference between a matrix and a dataframe?
A dataframe can contain vectors with different inputs and a matrix cannot. (You can have a dataframe of characters, integers, and even other dataframes, but you can’t do that with a matrix.A matrix must be all the same type.)
So, the data frame can have different vector of character, numbers, logical, etc. and it is still cool. But, for matrix you need only one type of data type. Phewww !!
Q.118. Explain general format of Matrices in R?
General format is
>Temp_matrix< – matrix (vector, nrow=r ,ncol=c , byrow=FALSE,
dimnames = list ( char_vector_ rowname, char_vector_colnames))
Q.119. Define repeat.
Repeat loop executes a sequence of statement multiple times. It don’t put the condition at the same place where we put the keyword repeat.
Example
name <- c(“Pappu”, “John”)
> temp <- 5
> repeat {
print(name)
temp <- temp+2if(temp > 11) {
break
}
}
So, this will return the name vector 4 times. First it prints the name and then increase the temp to 7 and so on.
Q.120. Define while.
In the while loop the condition is tested and the control goes into the body only when the condition is true
Example
name <- c(“Pappu”, “John”)
> temp <- 5
> repeat (temp<11) {
print(name)
temp <- temp+2
}
The name will be printed 4 times
Q.121. Define the for loop.
The for loop are not limited to integers. You can pass character vectors, logical vectors, lists or expressions.
Example.
x<- LETTERS[1:2]
for ( i in x) {
print(i)
}
[1] “A”
[2] “B”
Q.122. What is the syntax of a function in R?
Name_of_function<- function(argument_1,argument_2,..)
{
function body
}
Argument is the place holder , whenever a function is invoked, it pass a value to the argument. Arguments are optional
Q.123. What is the use of sort() function? How to use the function to sort in descending order?
Elements in a vector can be sorted using the function sort()
Example.
> temp <- c(3,5,2,6,7,1)
>sort_temp<- sort(temp)
> print(sort_temp)
[1] 1 2 3 5 6 7
>rev_sort<- sort(temp, decreasing = TRUE)
[1] 7,6,5,3,2,1
This function also works with the words
Q.124. What is the use of subset() function and sample() function in R ?
In R, subset() functions help you to select variables and observations while through sample() function you can choose a random sample of size n from a dataset.
**Suppose there is adata.frame
data_frame_example<- data.frame(a = c(10, 20, 30), b = c(40, 50, 60), c(70, 80, 90))…
Q.125. Determine the output of the following function f(2).
b <- 4
f <- function(a)
{
b <- 3
b^3 + g(a)
}
g <- function(a)
{
a*b
}
The global variable b has a value 4. The function f has an argument 2 and the function’s body has the local variable b with the value 3. So function f(2) will return 3^3 + g(2) and g(2) will give the value 2*4 = 8 where 4 is the value of b.
Thus, the answer is 35
Q.126. How to set and get the working directory in R ?
setwd() and getwd() functions are used to set a working directory and get the working directory for R.
setwd() is used to direct R to perform any action in that location and to directly import objects from there itself.
getwd() is used to see which is the current working directory of R
Q.127. Get all the data of the person having maximum salary.
max_salary_person<- subset(data, salary == max(salary))
print(max_salary_person)
Q.128. Now create an output file which will have data of all the people who joined TCS in 2016 with salary more than 300000
temp <- subset(data, company==”TCS” & salary > 300000 &as.Date(DOJ) >as.Date(“2016-01-01”))
write.csv(temp,”output.csv”,row.names = FALSE)
new_temp<- read.csv(“output.csv”)
print(new_temp)
Q.129. How to combine multiple vectors in one data frame?
Example.
a <- c(1,2,3,4)
b<- c(“Amit”,”Sumit”,”Gaurav”)
c<- c(“TCS”,”CTS”,”Musigma”)
df<- cbind(a,b,c)
print(df)
Q.130. What is the function of merge() function?
We can merge two data frames by using the merge() function. The data frames must have same column names on which the merging happens.
Example.
df1<- data.frame(id<- c(1:6), name <- c(rep(“Amit”,3), rep(“Sumit”,3))
df2<- data.frame(id<-c(7,8,9), name<- c(rep(“Nitin”,2), rep(“Paplu”,1))
*outer join
merge(x=df1, y=df2, by = “id”, all = TRUE)
This all = TRUE will give you the outer join, so the new data set will have all the value from both the data frame merged on the id
Q.131. How to ideally use the read.csv() function?
You must be wondering that it’s very easy to use a csv file by putting the name inside the read.csv() function. But, in most of the cases we also need to put some extra conditions in order to get things right and less frustrating for us.
Use the below syntax for the use.
my_data<- read.csv(“filename.csv”, stringsAsfactors = FALSE,
strip.white=TRUE, na.strings=c(“NA”,””))
stringsAsFactors = FALSE tells R to keep character variables as they are rather than convert to factors.
strip.white = TRUE removes spaces at the start and end of character elements. R treats “game” and ” game” differently, which is not usually desired.
na.strings = c(“NA”,””) tells R that in addition to the usual NA, empty strings in columns of character data are also to be treated as missing
Q.132. What is lapply() function in R?
lapply() function is used when you want to apply a function to each element of a list in turn and get a list back.
Example.
x<- list(a=1, b=1:3, c=10:100)
lapply(x,FUN=length)
$a
[1] 1
$b
[1] 3
$c
[1] 91
You can use other functions like max, min, sum, etc.
Q.133. What is sapply() function in R?
sapply() function is used when you want to apply a function to each element of a list in turn, but you want a vector back, rather than a list.
Vector is useful sometimes because it will get you a set of values and you can easily perform an operation on it.
Example.
x <-list(a =1, b =1:3, c =10:100)
#Compare with above; a named vector, not a list
sapply(x, FUN = length)
a b c
1391
sapply(x, FUN = sum)
a b c
165005
Q.134. How to make scatterplot in R?
Scatterplot is a graph which shows many points plotted in the Cartesian plane. Each point holds 2 values which are present on the x and y axis. The simple scatterplot is plotted using plot() function.
The syntax for scatterplot is:-
plot(x, y ,main, xlab, ylab, xlim, ylim, axes)
Where
x is the data set whose values are the horizontal coordinates
y is the data set whose values are the vertical coordinates
main is the tile in the graph
xlab and ylab is the label in the horizontal and vertical axis
xlim and ylim are the limits of values of x and y used in the plotting
axes indicates whether both axis should be there on the plot
plot(x =input$wt,y=input$mpg,
xlab=”Weight”,
ylab=”Milage”,
xlim= c(2.5,5),
ylim= c(15,30),
main=”Weight vsMilage”
)
Q.135. How to write a countdown function in R?
timer<- function(time)
{
print(time)
while(time!=0)
{
Sys.sleep(1) time<- time – 1
print(time)
}
}
countdown(5)
[1] 5
[2] 4
[3] 3
[4] 2
[5] 1
Q.136. Is array a matrix or matrix an array?
Every matrix can be an array but every array need not be a matrix. A matrix cannot have more than 2 dimensions, whereas an array can be multi dimensional.
Python
Q.137. WAP to show the use of if-elif-else
if salary>20000:
print(“Good Salary”)
elif salary<20000
print(“Average Salary”)
else
print(“Salary is 20000”)
Q.138. WAP to create a dictionary and then iterate over it and print
lucky_number = {‘Amit’:4,’Rahul’:6,’Nihar’:8}
for name,number in lucky_number.items():
print(name+’prefers’+str(number))
Q.139. WAP to access all the keys in the dictionary.
lucky_number = {‘Amit’:4,’Rahul’:6,’Nihar’:8}
for name in lucky_number.keys():
print(name)
Q.140. How to read a file and store the lines in your variable.
filename = ‘abc.txt’
with open(filename) as file_object:
lines = file_object.readlines()
for line in lines:
print(line)
Q.141. Exceptions helps us to be prepared for an error which might occur in the program. WAP to showcase how an exception works.
x = “What is your age?”
inp = input(x)
try:
inp = int(inp)
except ValueError:
print(“Sorry, Please Try again latter”)
else:
print(“That’s a beautiful age “)
Q.142. Try the following operations using List
TDM = [‘The’,’Data’,’Monk]
- Print the last object of the list
print(TDM[-1]) - Change the last element to Monkey
TDM[-1] = ‘Monkey - Remove Monkey from the list
del TDM[-1] - GET Monk back to the list
TDM.append(‘Monk’)
Q.143. Print all the Prime numbers less than 20
i = 2
while(i < 20):
j = 2
while(j <= (i/j)):
if not(i%j):
break
j = j + 1
if (j > i/j) :
print (i,” is a prime number”)
i = i + 1
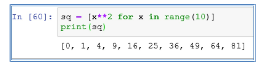
Q.144. Write a function to print the square of all numbers from 0 to 11
sq = [x**2 for x in range(10)] print(sq)
Q.145. How does a mutable list works?
list_example = [‘Amit’,’Sumit’,’Rahul’]
print(list_example)
list_example[1] = ‘Kamal’
print(list_example)
[‘Amit’, ‘Sumit’, ‘Rahul’]
[‘Amit’, ‘Kamal’, ‘Rahul’]
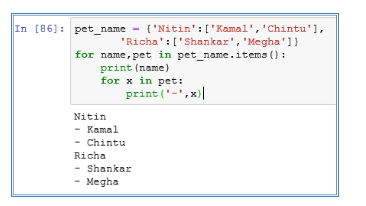
Q.146. Write a code to put a list into dictionary
pet_name = {‘Nitin’:[‘Kamal’,’Chintu’],
‘Richa’:[‘Shankar’,’Megha’]}
for name,pet in pet_name.items():
print(name)
for x in pet:
print(‘-‘,x)
Q.147. How to pass a list to a function?
def game_name(name):
for x in game_name
print(x)
example = [‘Cricket’,’Football’,’TT’]
game_name(example)
Q.148.When you don’t know how many arguments will be passed to a function, then you need to pass a variable number of arguments. Show by an example.
def pizza(size, *toppings):
print(“\nMaking a ” + size + ” pizza.”)
print(“Toppings:”)
for topping in toppings:
print(“- ” + topping)
# Make three pizzas with different toppings.
make_pizza(‘small’, ‘pepperoni’)
make_pizza(‘large’, ‘bacon bits’, ‘pineapple’)
make_pizza(‘medium’, ‘mushrooms’, ‘peppers’, ‘onions’, ‘extra cheese’)
Q.149. How to split a dataset into train and test in python?
Splitting a dataset into train and test is one of the initial stage of most of the machine learning models.
Following is how you can split dataset in python:-
from sklearn.model_selection import train_test_split
X_train,X_test,Y_train,Y_test = train_test_split(dataframe_name,target_variable,test_size=0.3, random_state=42)
dataframe_name = the complete dataset as a panda dataframe
target_variable = the name of the target variable
test_size = 0.3 denotes 70-30 split of the dataset in train and test
random_state = 42, Look for the explanation in the next question
Q.150.What will be the output of the print(str*3) if str=”TheDataMonk”?
It will print TheDataMonk three times
str=’TheDataMonk’
print(str*3)
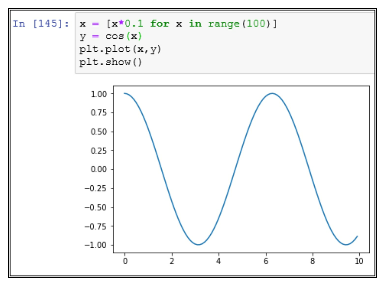
Q.151. Plot a sin graph using line plot
import matplotlib.pyplot as plt
from numpy import cos
x = [x*0.01 for x in range(100)]
y = cos(x)
plt.plot(x,y)
plt.show()
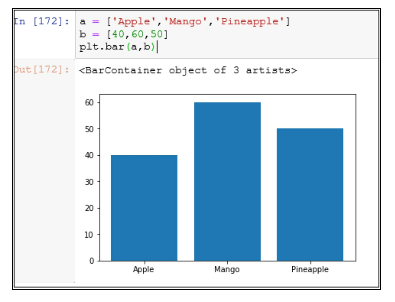
Q.152. Plot a bar chart
import matplotlib.pyplot as plt
a = [‘Apple’,’Mango’,’Pineapple’]
b = [40,60,50]
plt.bar(a,b)
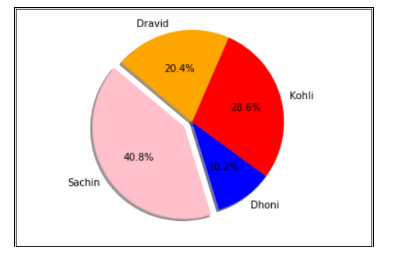
Q.153. Create a pie chart for the number of centuries scored by Sachin, Dhoni, Dravid, and Kohli.
labels = ‘Sachin’,’Dhoni’,’Kohli’,’Dravid’
size = [100,25,70,50]
colors = [‘pink’,’blue’,’red’,’orange’]
explode = (0.1,0,0,0)
plt.pie(size,explode=explode,labels=labels,colors=colors,autopct=’%1.1f%%’,shadow=True,startangle=140)
plt.axis(‘equal’)
plt.show()