Applications of CRO ( Cathode Ray Oscilloscope )
Last Updated on October 5, 2015 by Sasmita
Applications of CRO
In our previous post we discussed the block diagram of CRO and also studied various parts of it in detail. In this article we shall study some important applications of CRO , such as :
- Examination of Waveform
- Voltage measurement
- Current measurement
1. Examination of Waveform
One of the important application of CRO is to observe the wave shapes of voltages in various type of electronic circuits.
To do this, the signal under study is applied to vertical input terminals i.e. the ertical deflection plates of the oscilloscope.
The sweep circuit is set to internal so that sawtooth wave is applied to the horizontal input terminals i.e. the horizontal deflection plates.
Then various controls are adjusted to get sharp and well defined signal waveform on the screen.
Fig below shows the circuit for studying the performance of an audio frequency amplifier.
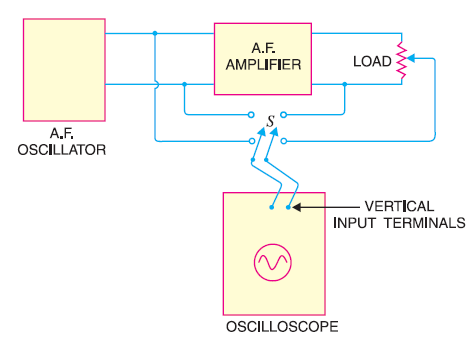
With the help of switch S, the output and input of amplifier is applied in turn to the vertical input terminals of the CRO . I f the waveforms are identical in shape, the fidelity of the amplifier is excellent.
Before discussing the next applications let us see how the signal waveform is displayed on CRO .
Display of signal waveforms on CRO
Applying Signal Across Vertical Plates
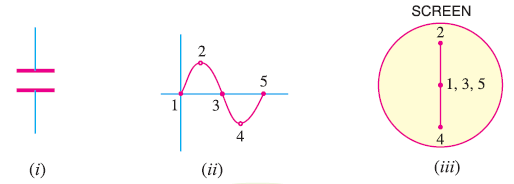
When a sinusoidal voltage is applied to the vertical deflection plates, it makes the plates alternately positive and negative. Thus, in the positive half cycle, upper plate is positive and lower plate is negative and in the negative half cycle, the plate polarities are reversed.
As a result, the spot moves up and down at the same rate as the frequency of the applied voltage.
Since the frequency of the applied voltage is 50 Hz, hence we will see a continuous vertical line 2-1-4 on the screen as shown in fig below. This line gives no indication of the manner in which the voltage is alternating hence we can not get the wave shape.
Applying Saw-tooth Wave Across Horizontal Plates
To see the signal voltage variation with time on screen we have to move the beam horizontally from left to right at a uniform speed while it is moving up and down.
Again as soon as a full cycle of the signal is traced, the beam should return quickly to the left hand side of the screen so that it can start tracing the second cycle.
In order to move the beam from left to right at a uniform rate, a voltage that varies linearly with time should be applied to the horizontal plates.This can be achieved by applying a saw tooth wave as shown in fig below.
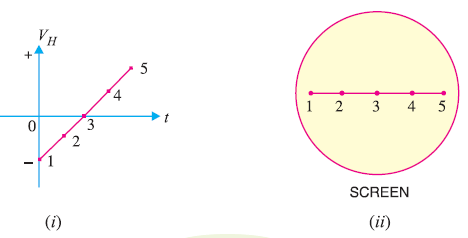
At time t=0, the negative voltage on the horizontal plate keep the beam to the extreme left on the screen as shown in the above figure .
As the time progresses, the negative voltage decreases linearly with time and the beam moves towards right forming a horizontal line. In this way, the saw tooth wave applied to horizontal plates moves the beam from left to right at a uniform rate.
Signal Pattern on Screen
When the signal voltage is applied to the vertical plates and saw-tooth wave to the horizontal plates,we get the exact pattern of the signal on the screen as shown in fig. below.
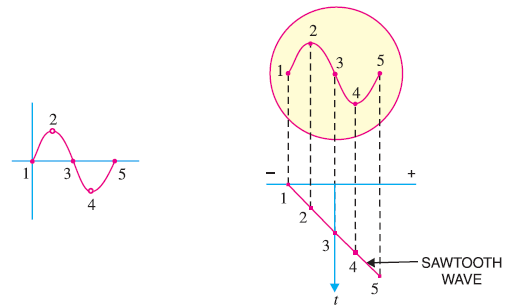
When the signal is at the instant 1, its amplitude is zero, and at this instant maximum negative voltage is applied to the horizontal plates. As a result the beam appears at extreme left on the screen as shown in fig.
When the signal is at instant 2, its amplitude is maximum, but the negative voltage on the horizontal plates is decreased at this instant. Hence, the beam is deflected upwards by the signal and towards right by the saw tooth wave. As a result, the beam strikes the screen at 2.
In a similar manner, the beam strikes the screen at 3,4 and 5 and we get the exact pattern of the signal on the screen.
2. Voltage Measurement
As we have already discussed, when th esignal is applied to the vertical deflection plates only, a vertical line appears on the screen.
The height of the line is proportional to the peak-to-peak voltage of the applied signal.
To measure the voltage on CRO, the following steps are followed :
- Shut off the internal horizontal sweep generator
- Attach a tracing paper to the face of the oscilloscope. Mark off the paper with vertical and horizontal lines in the form of graph.
- Now, calibrate the oscilloscope against a known voltage. Apply the known voltage to the vertical input terminals. Since, the sweep circuit is off, you will get a vertical line. Adjust the vertical gain till a good deflection is obtained. Let the deflection sensitivity is V volts/mm.
- Keeping the vertical gain unchanged, apply the unknown voltage to be measured, to the vertical input terminals of the oscilloscope.
- Measure the length of the vertical line obtained. Let it be l mm.
- Now the unknown voltage = l×V volts.
3. Frequency Measurement
Using a CRO , the unknown frequency can be accurately determined following the below steps :
- A known frequency is applied to the horizontal input and unknown frequency to the vertical input.
- The various controls are adjusted.
- A pattern with loops is obtained.
- The number of loops cut by the horizontal line gives the frequency on the vertical plates(fV) and the number of loops cut by the vertical line gives the frequency on the horizontal plates(fH).
So,
fV /fH= No. of loops cut by the horizontal line/No. of loops cut by the vertical line
To understand this better, let us take an example.
Suppose during the frequency measurement test, a pattern as shown in fig. below is obtained.
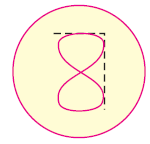
Let us assume that frequency applied to the horizontal plate is 2000 Hz.
Now, if we draw horizontal and vertical lines, we can see that one loop is cut by the horizontal line and two lops are cut by the vertical line.
Therefore,
fV /fH= 1/2
Or, fV /2000= 1/2
Or, fV = 2000× 1/2 = 1000 Hz
Hence unknown frequency is 1000 Hz.